For franchise development at 10 to 100 unit brands
Site packets your prospect's attorney and banker can check.
Type a candidate address. In about a minute Groundwork draws the real drive-time trade area, counts who lives in it from the US Census, counts competitors and anchors, scores the site against your own criteria and writes the prospect-facing report.
AI-written territory reports are a liability. Groundwork never fills a gap with a plausible number: when it cannot measure enough, the verdict reads Incomplete.
The check needs no account and gives a demographic fit score. The full verdict, with competitors and anchors counted, comes with a free workspace: 5 sites a month against your own criteria, no card.
- US Census ACS 5-yearBlock-group demographics, with median income computed from the full income distribution.
- About a minuteFor a fresh analysis with competitors counted; a few seconds for the free check. Re-opening a site you already ran costs nothing.
- Incomplete, never a guessBelow 60% of the weighted signals measured, there is no score.
- Two versions of every reportInternal for your team, prospect-facing for theirs.
The packet
One prospect, one download
Save a prospect's candidate sites, press Download packet, and you get one zip, built for the people your prospect forwards it to.
- whitfield-group-denver-packet.zip
- comparison.xlsx and .csv: the candidate sites side by side in 37 columns, and only the candidates
- overview-map.svg every trade area on one map, coloured by verdict
- highlands-ranch-co/ one folder per site
- …-prospect.docx and .html
- …-internal.docx and .html
- …-map.png the trade-area map, once captured
- …-places.xlsx the places workbook, if you built one
- cherry-creek-denver-co/
- README.txt what each file is
Written for the prospect's attorney and banker
Follows counsel-style rules. It leaves out the score and the scoring table, the names of your existing units, comparisons with other markets, market-type labels and financial figures: the reader gets the verdict and the facts, never the points. It says "Viable" instead of "Approved" and ends with a compliance paragraph that points the reader to the FDD.
Everything, for your team
The full scoring, named units and the spacing check, and comparable markets with the verdict each got, once your market history has enough decided sites.
Also on the prospect page: the places workbook, an Excel list of the businesses of a chosen kind inside the trade area, nearest first, with address, phone and website where the listing has them. A franchisee's first local-marketing list.
How it works
From an address to a packet in three steps
Type an address or click the map
Measure the trade area by drive time, walk, bike, a plain radius or the official city boundary. The dashed 3-mile circle stays on screen, so you can see how far the real area differs from the ring.
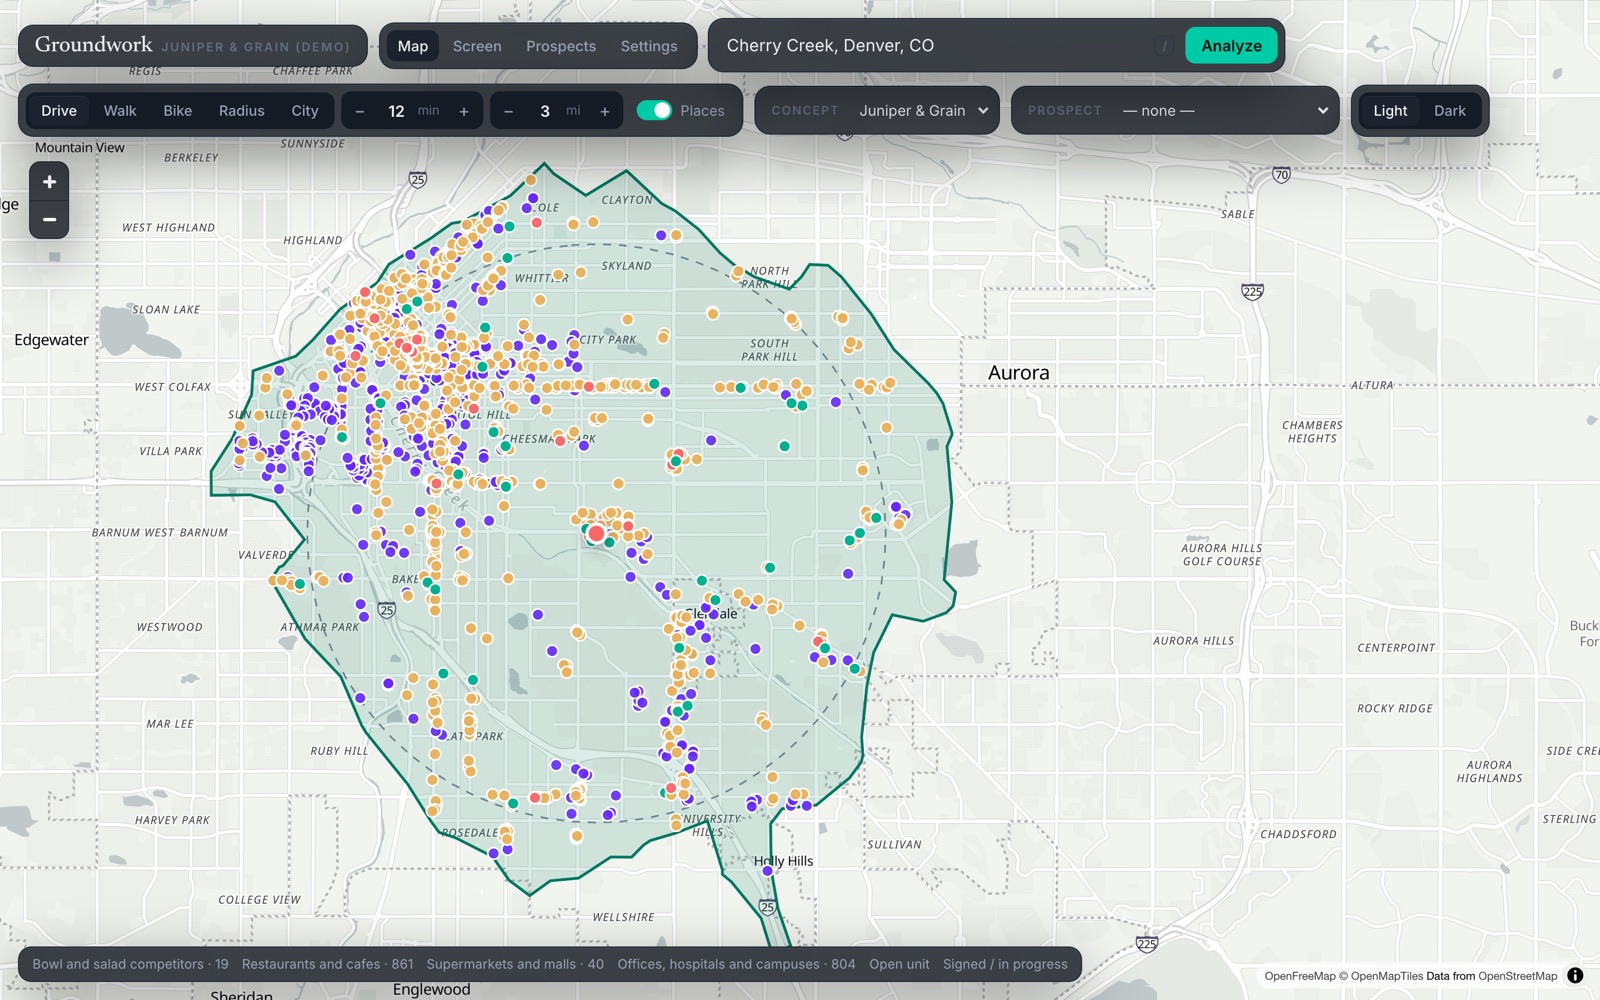
A 12-minute drive time next to the 3-mile ring.
Read the verdict: your criteria, applied
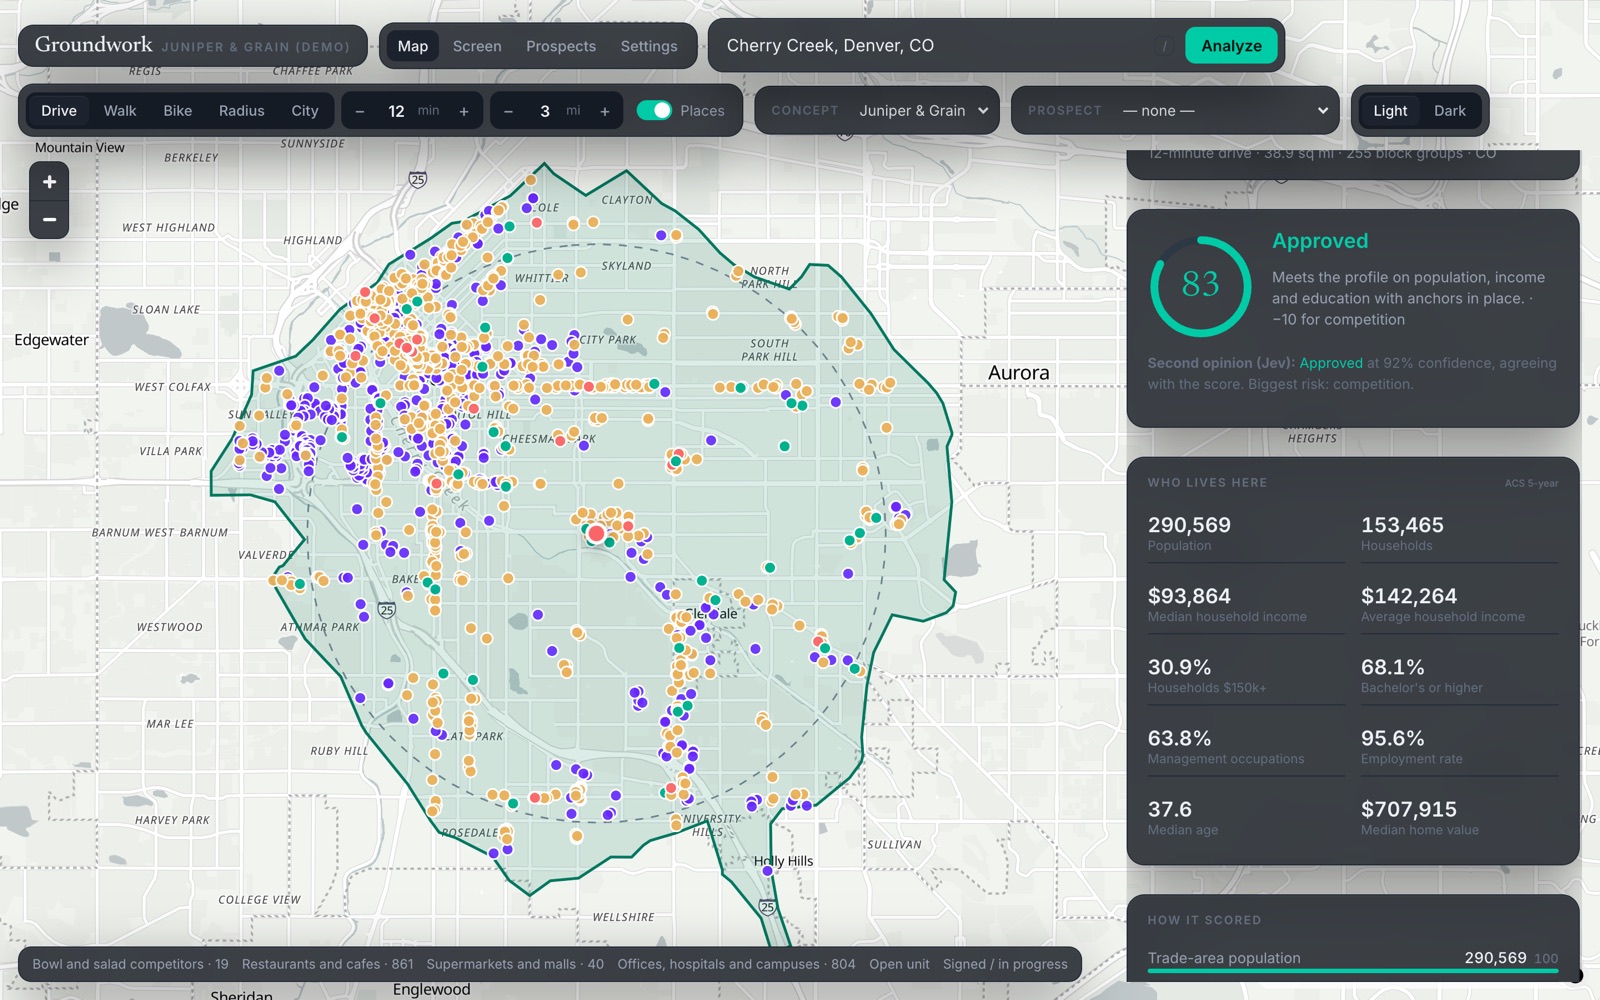
A 0 to 100 score and Approved, Conditional or Not Approved against your own verdict bands, with how each signal scored, who lives there, the city it sits in, competitors and anchors from TomTom's business listings, and your nearest units. The card says what it is: a fit against your thresholds, not a forecast of sales.
Every verdict shows its work.
Build the packet
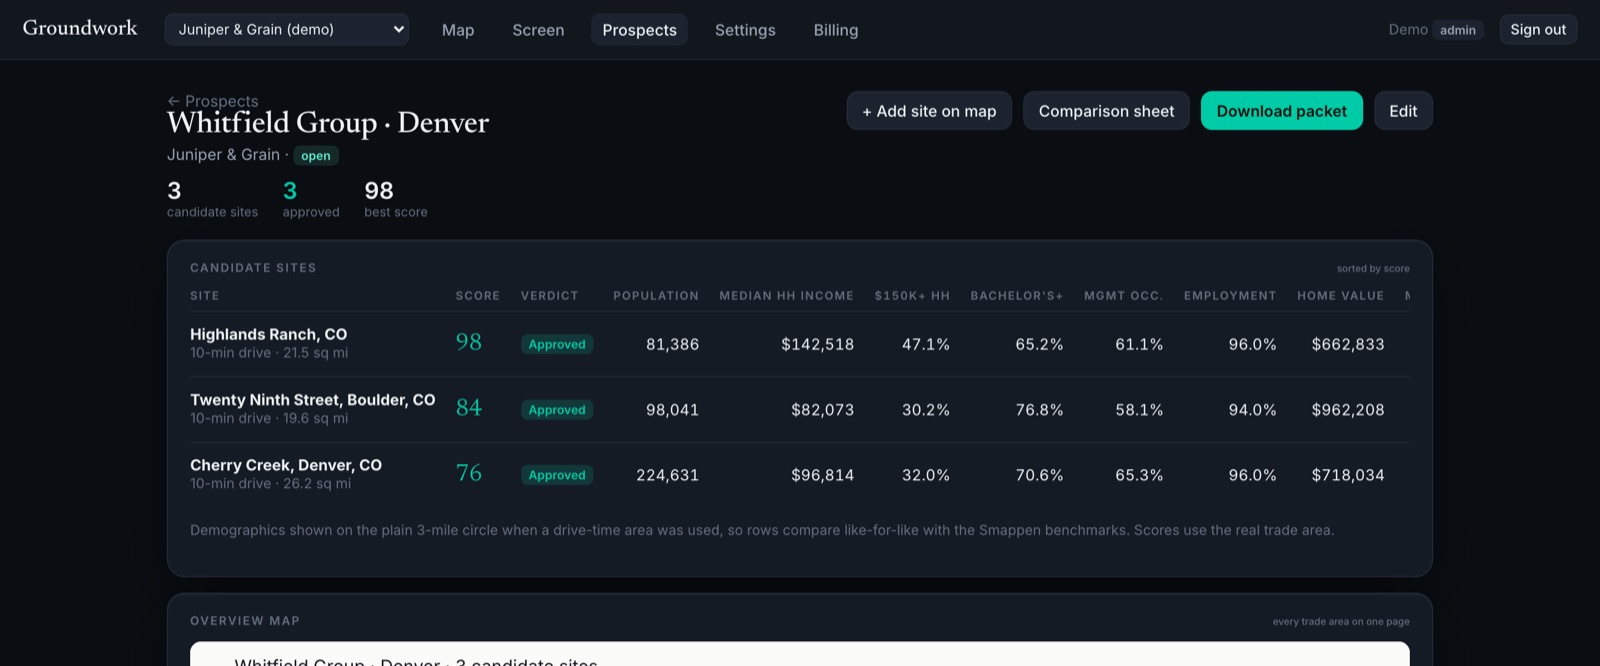
Save each candidate site to a prospect. The prospect page sorts them by score in your comparison-sheet columns, and Download packet zips the lot.
Three candidate sites, one prospect, one download.
Built to be checked
A packet is only worth sending if their advisors can check it
So the engine is deterministic, names its sources and shows its work.
It refuses to guess
If too little can be measured, the verdict says Incomplete and lists what is missing. If competitors and nearby anchors were not counted, it plays it safe: a missing count can only lower the score, never raise it, and the result says so.
Every verdict shows its work
Each signal's measured value, weight and points earned, against thresholds you set and can change in Settings.
Income figures you can defend
Median household income is worked out from the full Census income breakdown for the trade area, the way a professional market study does it, not by averaging neighbourhood figures. Median age and home value are averages of the neighbourhood figures.
Sources named
Census ACS for people, openrouteservice for drive times, Census TIGERweb for boundaries, TomTom's business listings for places. Exports carry the attribution. Data sources.
How accurate is it? Treat the verdict as a fast, consistent first read, not a sales forecast. It scores a site against the criteria you set and shows every number with its source, so your team can check it in a minute. Once you record eight of your own site decisions, it tunes its cut-offs to how your team actually decides, and Settings shows how often it agrees with you. We test it against real decisions and publish the results, including where it falls short: how we test it.
Pricing
Start free. Pay when you send packets.
Billed annually, with two months free, or month to month. No procurement, no long contract.
Free
See the verdict on your own sites.
- 5 sites a month, scored against your own criteria
- Drive-time trade area, Census demographics, city comparison
- Competitors and anchors from OpenStreetMap, or TomTom's business listings while the free plans' shared monthly TomTom allowance lasts
- Market history from your own stores and decisions
- 1 prospect-facing report download a month
- 2 seats
Brand
$2,990 a year, or $299 month to month. One concept, one development team.
- Unlimited sites and packets
- Word and HTML reports, comparison sheets, places workbooks, share links
- Your criteria as editable weights, thresholds and verdict bands
- Your units loaded for the spacing check
- 5 seats
Any plan paid annually, for the first 5 customers. Open until December 31, 2026.
- Brand at $2,242.50 a year
- In return: a short case study and permission to tune your scoring on your past site decisions
- List price after 24 months
Every plan starts as a free workspace. When you are ready, pick a plan on the Billing page inside the app and email us from there; we invoice and switch the workspace on the same day. Running several brands, or a franchise sales or real estate firm working for many? Group (up to 5 concepts) and Agency (up to 20, with packets under your own name and logo) are set up by hand: email us.
Rather we ran it for you? Done-for-you packet, $950. Send up to six addresses and get the full packet back within two business days of payment. No subscription, and credited against your first annual plan if you start one within 30 days of delivery (see the terms).
Order a packetQuestions
What buyers ask
How long does an analysis take?
Usually about a minute for a site nobody has run before, longer when a public data service is slow. The drive-time polygon, the Census block groups inside it, the city it sits in and the score take a few seconds; nearly all the rest is the places scan that counts competitors and anchors, which on this server runs on TomTom's business listings, a few requests a second, so a dense trade area takes longest. With Places off, or on the free check, it takes a few seconds. Re-opening a site you already ran is served from the cache and does not count against the free plan.
What does the free check give me?
A 0 to 100 demographic fit score for the 10-minute drive-time area around the address: how the people who live there (population, income, education, employment and housing) match a general-purpose profile, with every signal shown, plus who lives there and how the area compares with its city. It does not count competitors or anchors, so it gives no verdict. The full verdict counts the competitors and anchors inside the trade area and scores the site against your own criteria; run it free with an account.
Where does the data come from?
Demographics are US Census American Community Survey 5-year estimates at block-group level. Drive-time polygons come from openrouteservice. Municipal boundaries come from Census TIGERweb. Competitors, anchors and the places workbook come from TomTom's business listings, with OpenStreetMap as the fallback. Nothing is typed by hand: every number in a report traces back to one of those sources or to your own settings. Full list on the Data sources page.
We already use Smappen. Why would we add this?
Keep Smappen if you like it. Its feature page (smappen.com/features, checked 2026-10-28) covers travel-time areas, Census population data, business search, custom metric dashboards, an automated Word local market report, and Smappen AI, which answers where to open next on the map. Groundwork is narrower: it scores each candidate against your own written criteria and verdict bands, shows every signal's value and threshold, says Incomplete instead of guessing when data is missing, and writes a prospect-facing version that leaves out unit names, market comparisons and financial figures and points the reader to the FDD. Run one market in both and compare what lands in your prospect's inbox.
How is this different from Buxton?
Buxton is enterprise location analytics, now sold as "Audiense In-Person". Its site offers a demo request and no public price (buxtonco.com redirects to audiense.com/products/audiense-in-person, checked 2026-10-28). Groundwork is self-serve, monthly, and priced for a 20-unit brand. At 500 units you may want both.
Our site criteria are proprietary. Where do they go?
Into your own workspace, as signals with weights and thresholds, verdict bands, competitor rules and a spacing rule, all editable in Settings. Each workspace is separate. We do not show your criteria to another brand's workspace and we do not share them.
What does the prospect-facing report leave out?
The 0 to 100 score and the signal-by-signal scoring table, market-type labels, comparisons to other markets, the names of your existing units, and financial figures. The demographics, the city comparison and the competitors and anchors stay, each with its source. It says "Viable" instead of "Approved", notes only whether the site is inside your minimum spacing, and ends with a compliance paragraph that points the reader to the FDD. It is the version written for the prospect's banker and attorney to check: every figure names its source.
What if the packet is not better than what we have?
Tell us why within 14 days of delivery and we refund the $950. The policy is written into the terms.
Why I built this
The same day of work, every week
I run franchise development projects at a regional restaurant franchise. Every week a prospect asks about three to six sites, and every week it is the same day of work: pull a circle in a mapping tool, export the demographics, paste them into a Word template, write the recommendation, build the comparison sheet, zip it, send it.
Two things bothered me. The circle was wrong: re-run with a real drive time, our trade areas looked nothing like the 3-mile ring, and in one market a river cut the circle in half. And the output looked homemade next to what the prospect's banker was used to seeing.
So I built the tool I wanted. It pulls Census data at block-group level, scores the site against our criteria, and writes the packet. Now I'm opening it to other brands our size. If you are the person who does this at your brand, check one of your own sites and tell me where it falls short.
Christian Briganti
See it on one of your own sites
Check any US address in a few seconds, no account, for a demographic fit score. For the full verdict, with the competitors and anchors in the trade area counted, start a free workspace and score sites against your own criteria.
Rather it was done for you? Buy a packet for $950.